By Nik Hiles, Manager of Marketing Strategy
1. Introduction
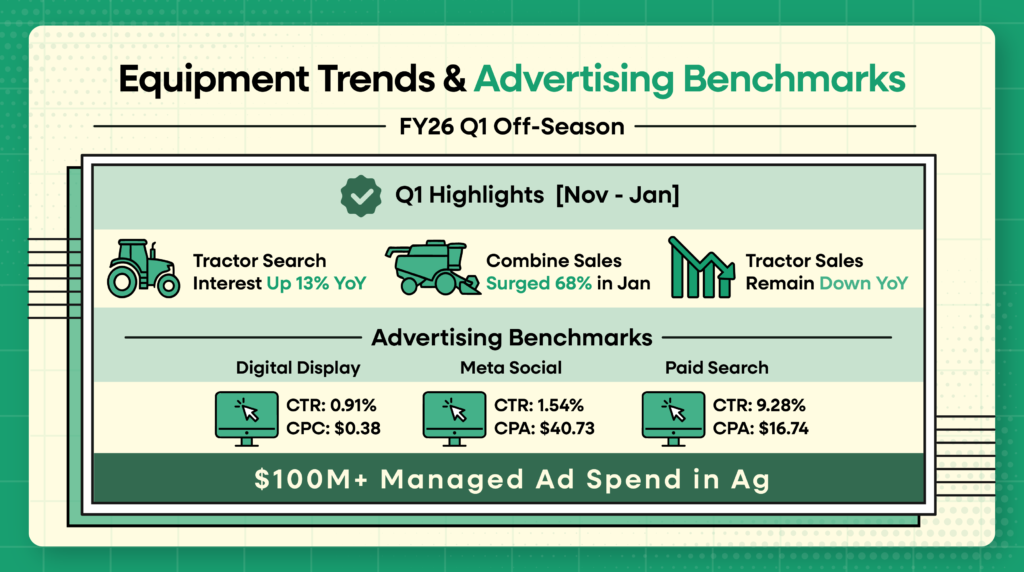
At Root+Beta, we’ve spent the last 15 years deep in the field helping agriculture equipment dealers and ag companies across the United States navigate the evolving world of digital advertising. With over $100 million in ad spend managed, R+B’s seasoned team of 40 brings unmatched industry expertise, data access, and insight to our clients every day.
As a Google Premier Partner, Root+Beta has full access to the Google Marketing Platform, beta programs, and advanced toolsets, but more importantly, we understand what matters to agriculture and equipment marketers.
Why We Built This Report
Let’s be honest: dependable benchmark data for ag and equipment marketing is tough to come by. We kept running into the same gap, so we decided to solve it ourselves. This report combines real performance data from over 20 agriculture equipment dealer groups, covering campaigns across the core digital platforms that drive results: Meta (Facebook and Instagram), Digital Display, and Paid Search. Every data point has been aggregated, vetted for accuracy, and contextualized specifically for ag marketers like you.
This goes beyond satisfying curiosity. Benchmarking provides real clarity: it helps you understand where you stand, where you’re lagging, and guides performance optimization efforts.
We believe performance should always be evaluated against three benchmarks:
- Historic performance
- Industry performance
- Platform performance
This report focuses on number two, your industry’s performance, across the digital channels that matter most for equipment advertising.
Agriculture Quarters
We’ve aligned our quarterly data with the agricultural planting and harvest cycle rather than the standard calendar year. This structure better reflects how ag businesses operate and when key marketing opportunities occur:
- Q1: November to January Late-Harvest/Off
- Q2: February to April Prep/Plant
- Q3: May to July Mid-Season
- Q4: August to October Harvest
To provide benchmarks that apply broadly across the industry, we’ve simplified seasonality into four quarters. That said, Root+Beta fully recognizes that seasonality, trends, and buying behavior vary by geography, crop type, and local conditions.
Ag Seasonality Source: US Department of Agriculture | Crop Calendars for United States
This Equipment Trends & Advertising Benchmarks
Q1 Off-Season Edition includes:
- Seasonal Interest & Sales Trends
- Media Benchmarks
- Digital Display
- Meta Social
- Paid Search
2. Seasonal Interest & Sales Trends
Google Search Trends
We filtered Google Search Trends to the “Agriculture and Forestry” category, isolating search interest around “Tractor” and “Agriculture” topics. This gave us a clearer view of annual patterns and highlighted shifts in audience behavior.
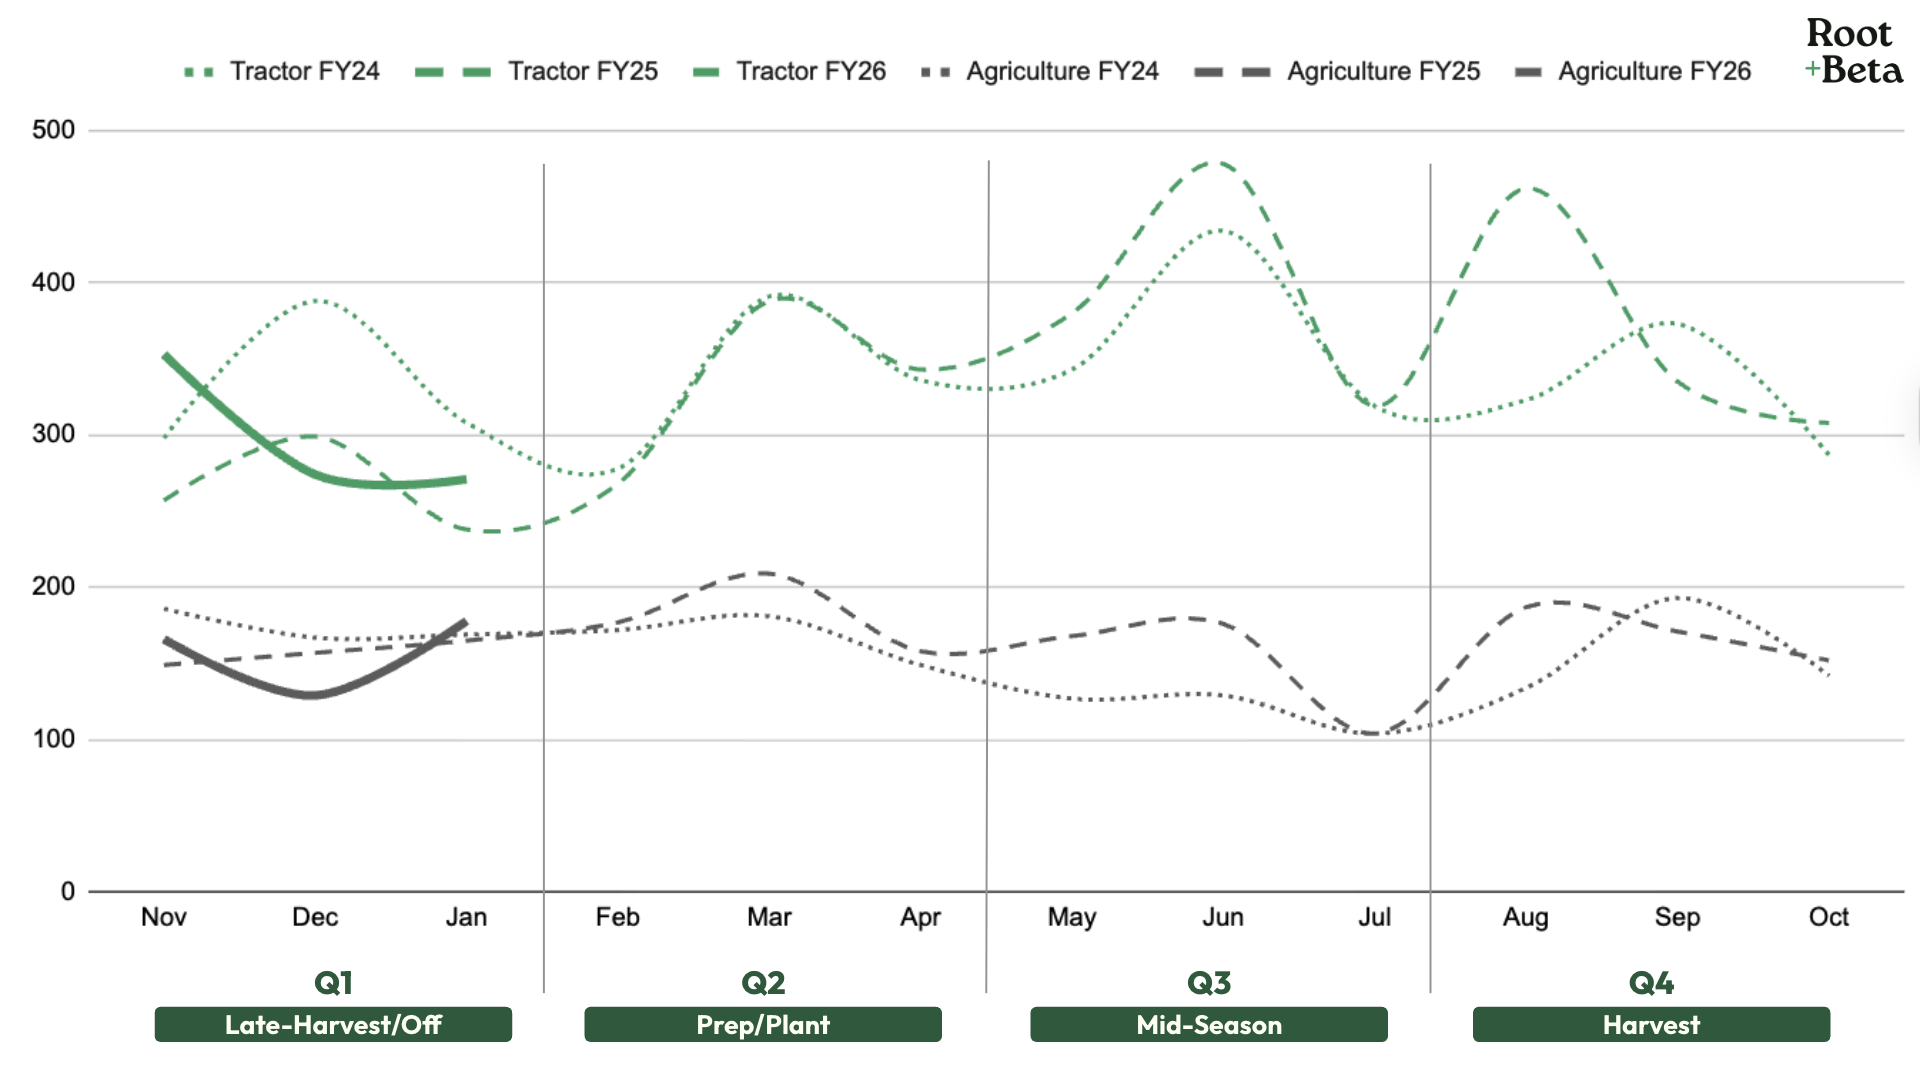
Overall, Q1 for FY26 saw year-over-year (YoY) interest growth for Tractors (up 13%) and negligible growth for Agriculture (up 0.4%) search themes. The main factor behind Tractors’ increased search interest was the lift seen in November 2025, which was 37% higher YoY, followed by a sharp 8% drop in December, which contradicts two years of data. Generally, during this off-season, sales slow down, but interest remains as farmers continue researching ag solutions and equipment. This is why Root+Beta recommends continuing to invest in paid search and organic search marketing efforts to capitalize on interest when the industry generally slows down.
Association of Equipment Manufacturers, Sales Data
When we compare Google Search Trends to Association of Equipment Manufacturers (AEM) sales data, tractor sales have not seen a corresponding lift in November, December, or January, highlighting the continued restraint farmers are exhibiting towards equipment investments. Tractor sales continued to be down, but only 4.7% when compared to being down 20% in October, 20% in November, and 15% in December. In an exciting change of events, Self-Propelled Combines saw a 68% change in January 2026, seeing 163 sales, in comparison to January 2025’s 97.
| US Sales | All Tractors | Combines |
|---|---|---|
| Nov ’25 | ↓ 19.6% | ↓ 35.2% |
| Dec ’25 | ↓ 14.8% | ↓ 4.3% |
| Jan ’26 | ↓ 4.7% | ↑ 68% |
AEM Sales Chart, Tractors & Combines
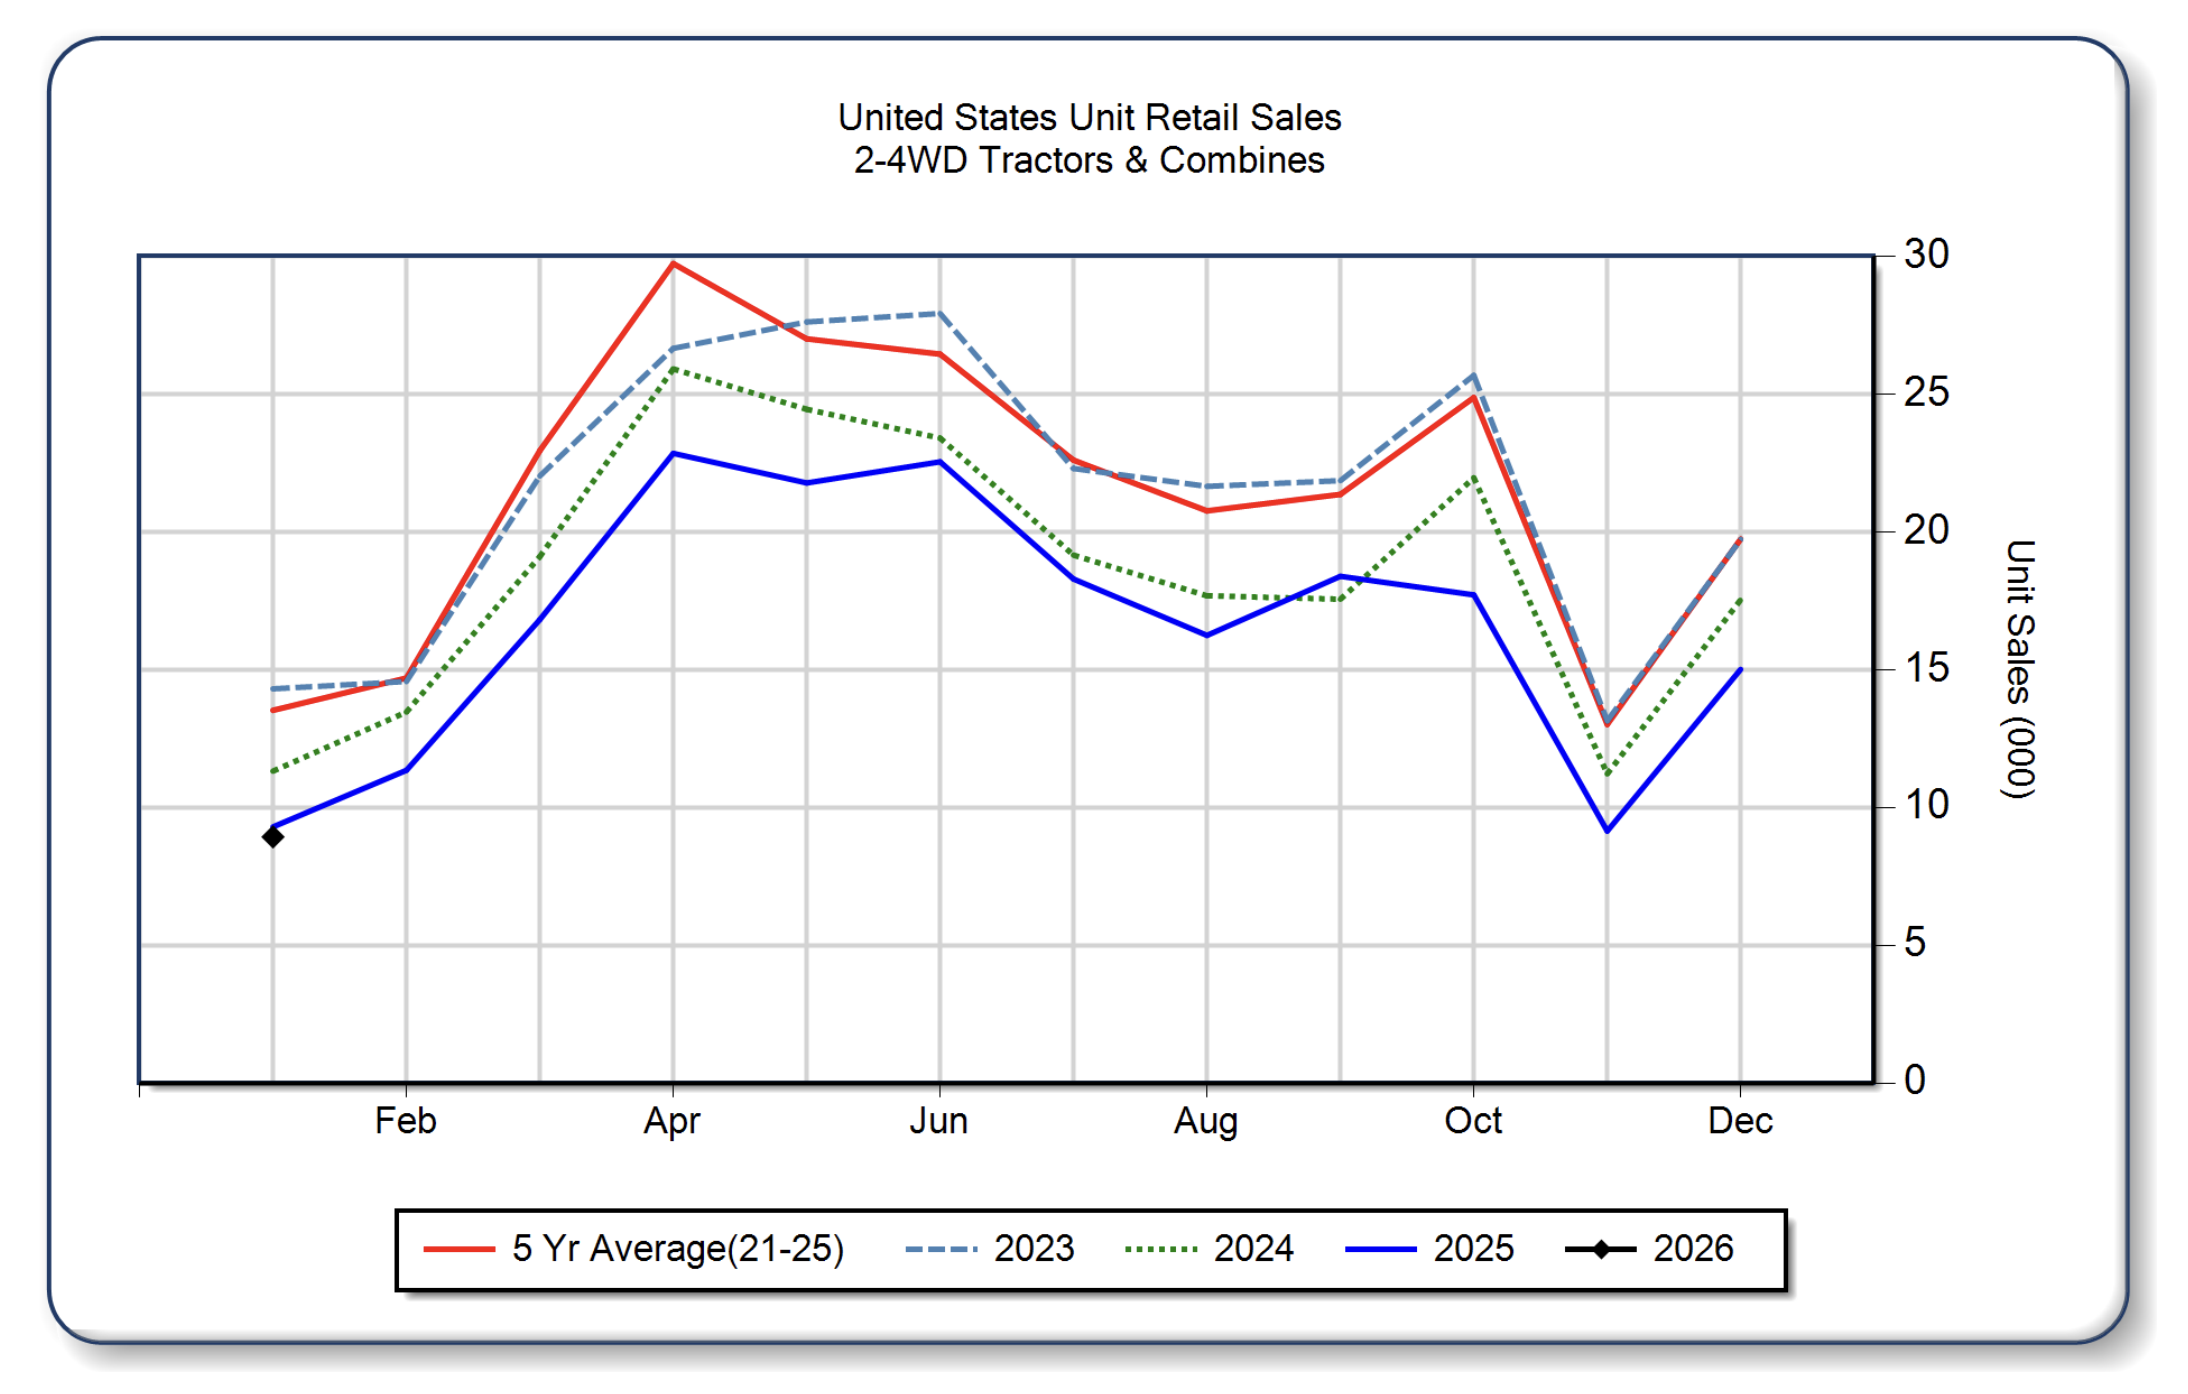
One factor at play is the Farmer Bridge Assistance Program announced on December 8, 2025, which dedicated $12 billion in economic assistance for farmers to prepare for the 2026 planting season. $11 billion of this program is dedicated to row crop farmers, which may be a factor in the combines sales lift in January 2026 that AEM highlighted.
3. Media Channel Benchmarks
Notes On Data Interpretation
These benchmarks are based on aggregated data from a mix of residential and agricultural equipment campaigns across varied markets. Results may differ based on your location, product focus, budget, and audience – use this data as directional guidance, not a one-size-fits-all standard.
Digital Display Advertising
Digital Display
| Industry | CTR | CPC | CVR | CPA |
|---|---|---|---|---|
| All Industries | 0.46% | $0.63 | 0.77% | $75.51 |
| Auto | 0.60% | $0.58 | 1.19% | $23.68 |
| Ag | 0.47% | $0.64 | n/a | n/a |
| R+B FY25 | 0.76% | $0.52 | 1.91% | $27.17 |
| R+B Q1 | 0.91% | $0.38 | 1.45% | $26.50 |
Across industries, digital display typically delivers click-through rates around 0.50%, with cost per click above $0.60. Agriculture generally mirrors those benchmarks. Yet across Root+Beta’s equipment dealership campaigns, performance often exceeds those norms, with many campaigns generating click-through rates above 1% and some surpassing 2%. Dynamic feed-based and responsive formats consistently outperform static creative in driving action, and R+B’s compact tractor focus, a category with broader appeal within ag’s niche market, further strengthens engagement.
Looking at Q1’s performance, we saw the expected seasonal decline in click costs as audience sizes and bidding pressure eased, resulting in Root+Beta’s average cost-per-click decreasing to $0.38. As Q2 progresses, competition across the digital landscape will intensify, putting upward pressure on costs. Higher impression and click costs should be anticipated in the upcoming quarters, but when campaigns are optimized and audience intent increases, stronger website conversion performance can follow.
| Period | CTR | CPC | CPM |
|---|---|---|---|
| FY ’25 Q1 | 0.77% | $0.34 | $2.63 |
| FY ’25 Q2 | 0.74% | $0.42 | $3.13 |
| FY ’25 Q3 | 0.76% | $0.92 | $6.94 |
| FY ’25 Q4 | 0.80% | $0.86 | $6.85 |
| FY ’26 Q1 | 0.91% | $0.38 | $3.48 |
Meta Social Advertising
Meta Social
| Industry | CTR | CPC | CVR | CPA |
|---|---|---|---|---|
| All Industries | 0.90% | $1.72 | 9.21% | $18.68 |
| Auto | 0.80% | $2.24 | 5.11% | $43.84 |
| Ag | 0.48% | $0.96 | n/a | n/a |
| R+B FY25 | 1.47% | $0.75 | n/a | n/a |
| R+B Q1 | 1.54% | $0.80 | n/a | n/a |
Meta continues to be a core platform for equipment advertisers, while performance trends on social media differ significantly from display advertising. Display often benefits from softer competition during the winter and Meta typically sees its highest click costs in the same period. As the weather improves and activity in the agriculture and residential tractor sectors increases, engagement strengthens, click-through rates rise, and advertising costs begin to ease. Seasonality plays a more pronounced role on social media, where buyer behavior and platform competition are closely linked.
With the rollout of our new API reporting platform, Root+Beta can now consistently track and report CPA benchmarks across all dealership campaigns. In FY26 Q1, dealerships running Meta campaigns focused on driving sales leads recorded an average CPA of $40.73. As seasonal demand builds into Q2, a combination of improving engagement rates and disciplined optimization should position these campaigns to generate leads more efficiently.
| Period | CTR | CPC |
|---|---|---|
| FY ’25 Q1 | 1.08% | $0.95 |
| FY ’25 Q2 | 1.66% | $0.70 |
| FY ’25 Q3 | 1.36% | $0.81 |
| FY ’25 Q4 | 1.56% | $0.69 |
| FY ’26 Q1 | 1.54% | $0.80 |
Paid Search
Paid Search
| Industry | CTR | CPC | CVR | CPA |
|---|---|---|---|---|
| All Industries | 3.17% | $2.69 | 3.75% | $48.96 |
| Auto | 4.00% | $2.46 | 6.03% | $33.52 |
| Ag | 5.74% | $2.19 | n/a | n/a |
| R+B FY25 | 11.26% | $2.75 | 17.70% | $15.51 |
| R+B Q1 | 9.28% | $2.16 | 12.93% | $16.74 |
Paid Search’s Q1 FY26 performance underscores the importance of evaluating Count, Cost, and Rate metrics in tandem. Year-over-year, both the Click-Through Rate (CTR) and Conversion Rate (CVR) declined. This dip was influenced by Google’s ongoing AI integrations, increased competitive investment, and broader economic pressures within the agriculture sector, which collectively reduced search website traffic. However, despite these lower rates, click and conversion costs have remained low, highlighting the continued value of paid search campaigns.
While the Cost Per Click (CPC) remains higher than broader agriculture benchmarks, our campaigns are intentionally optimized for conversions and target both farmer and residential equipment buyers. We prioritize qualified, high-intent traffic over lower-cost website visits, even as the evolving search landscape places modest upward pressure on conversion costs.
| Period | CTR | CPC | CVR | CPA |
|---|---|---|---|---|
| FY ’25 Q1 | 10.65% | $2.88 | 16.03% | $17.95 |
| FY ’25 Q2 | 12.02% | $2.48 | 19.52% | $12.72 |
| FY ’25 Q3 | 11.52% | $2.70 | 17.97% | $15.04 |
| FY ’25 Q4 | 10.46% | $3.06 | 15.99% | $19.12 |
| FY ’26 Q1 | 9.28% | $2.16 | 12.93% | $16.74 |
4. Appendix
Glossary
IMP – Impressions, the total number of times your ad has been seen.
CTR – Click-Through Rate, details ad engagement and interest.
Clicks – Action that leads to the website from ad or engagement clicks help show interactions.
CVR – Conversion Rate, how successful an ad is at converting website visitors to perform an action on the website or platform.
Conv. – Conversions are website results (actions) such as a call or form completion.
CPM – Cost-per-thousand impressions, key for detailing the cost of advertising on a platform.
CPC – Cost-Per-Click, which details how much it costs for an ad interaction (display and SEM)
CPA – Cost-per-action, which details how much it costs for a desired web lead.
Conversions vary based on advertisers’ campaign goals and website opportunities, but generally conversions fall into the following categories: form fills, calls, get directions, etc.
Industry Benchmark Sources
- https://www.wordstream.com/blog/ws/2017/02/28/facebook-advertising-benchmarks
- https://www.wordstream.com/blog/ws/2016/02/29/google-adwords-industry-benchmarks
- https://www.storegrowers.com/google-ads-benchmarks/
- https://thinkshiftinc.com/blog/2024-digital-advertising-benchmarks-for-agriculture
Research Sources
- Ag Seasonality Source: US Department of Agriculture | Crop Calendars for United States
- Tractor Sales: Association of Equipment Manufacturers | US Ag Tractor and Combine Reports
- https://www.aem.org/market-share-statistics/us-ag-tractor-and-combine-reports
- https://www.aem.org/getattachment/787f93c0-9c42-4e8a-ad8a-f2792b110d1e/January-2026-Farm_Flash_Trade_Press_With_Chart_PreRelease-United-States.pdf
- https://www.aem.org/getattachment/9ee3a193-4c55-4c47-8e3a-ec1237b41f09/US-Month-Ag-Report-2025-12.pdf
- https://www.aem.org/getattachment/8a703e9d-fcc3-4b77-8fcb-4a3d1845b814/US-Month-Ag-Report-2025-11.pdf
- Google Internal Data for Agriculture Equipment | United States.
- Time period: 05/24/2025-08/21/2025
- Farmer Bridge Assistance Program