By Nik Hiles, Manager of Marketing Strategy
1. Introduction
At Root+Beta, we’ve spent the last 15 years deep in the field helping agriculture equipment dealers and ag companies across the United States navigate the evolving world of digital advertising. With over $100 million in ad spend managed, R+B’s seasoned team of 40 brings unmatched industry expertise, data access, and insight to our clients every day.
As a Google Premier Partner, Root+Beta has full access to the Google Marketing Platform, beta programs, and advanced toolsets, but more importantly, we understand what matters to agriculture and equipment marketers.
Why We Built This Report
Let’s be honest: dependable benchmark data for ag and equipment marketing is tough to come by. We kept running into the same gap, so we decided to solve it ourselves. This report combines real performance data from over 20 agriculture equipment dealer groups, covering campaigns across the core digital platforms that drive results: Meta (Facebook and Instagram), Digital Display, and Paid Search. Every data point has been aggregated, vetted for accuracy, and contextualized specifically for ag marketers like you.
This goes beyond satisfying curiosity. Benchmarking provides real clarity: it helps you understand where you stand, where you’re lagging, and guides performance optimization efforts.
We believe performance should always be evaluated against three benchmarks:
- Historic performance
- Industry performance
- Platform performance
This report focuses on number two, your industry’s performance, across the digital channels that matter most for equipment advertising.
Agriculture Quarters
We’ve aligned our quarterly data with the agricultural planting and harvest cycle rather than the standard calendar year. This structure better reflects how ag businesses operate and when key marketing opportunities occur:
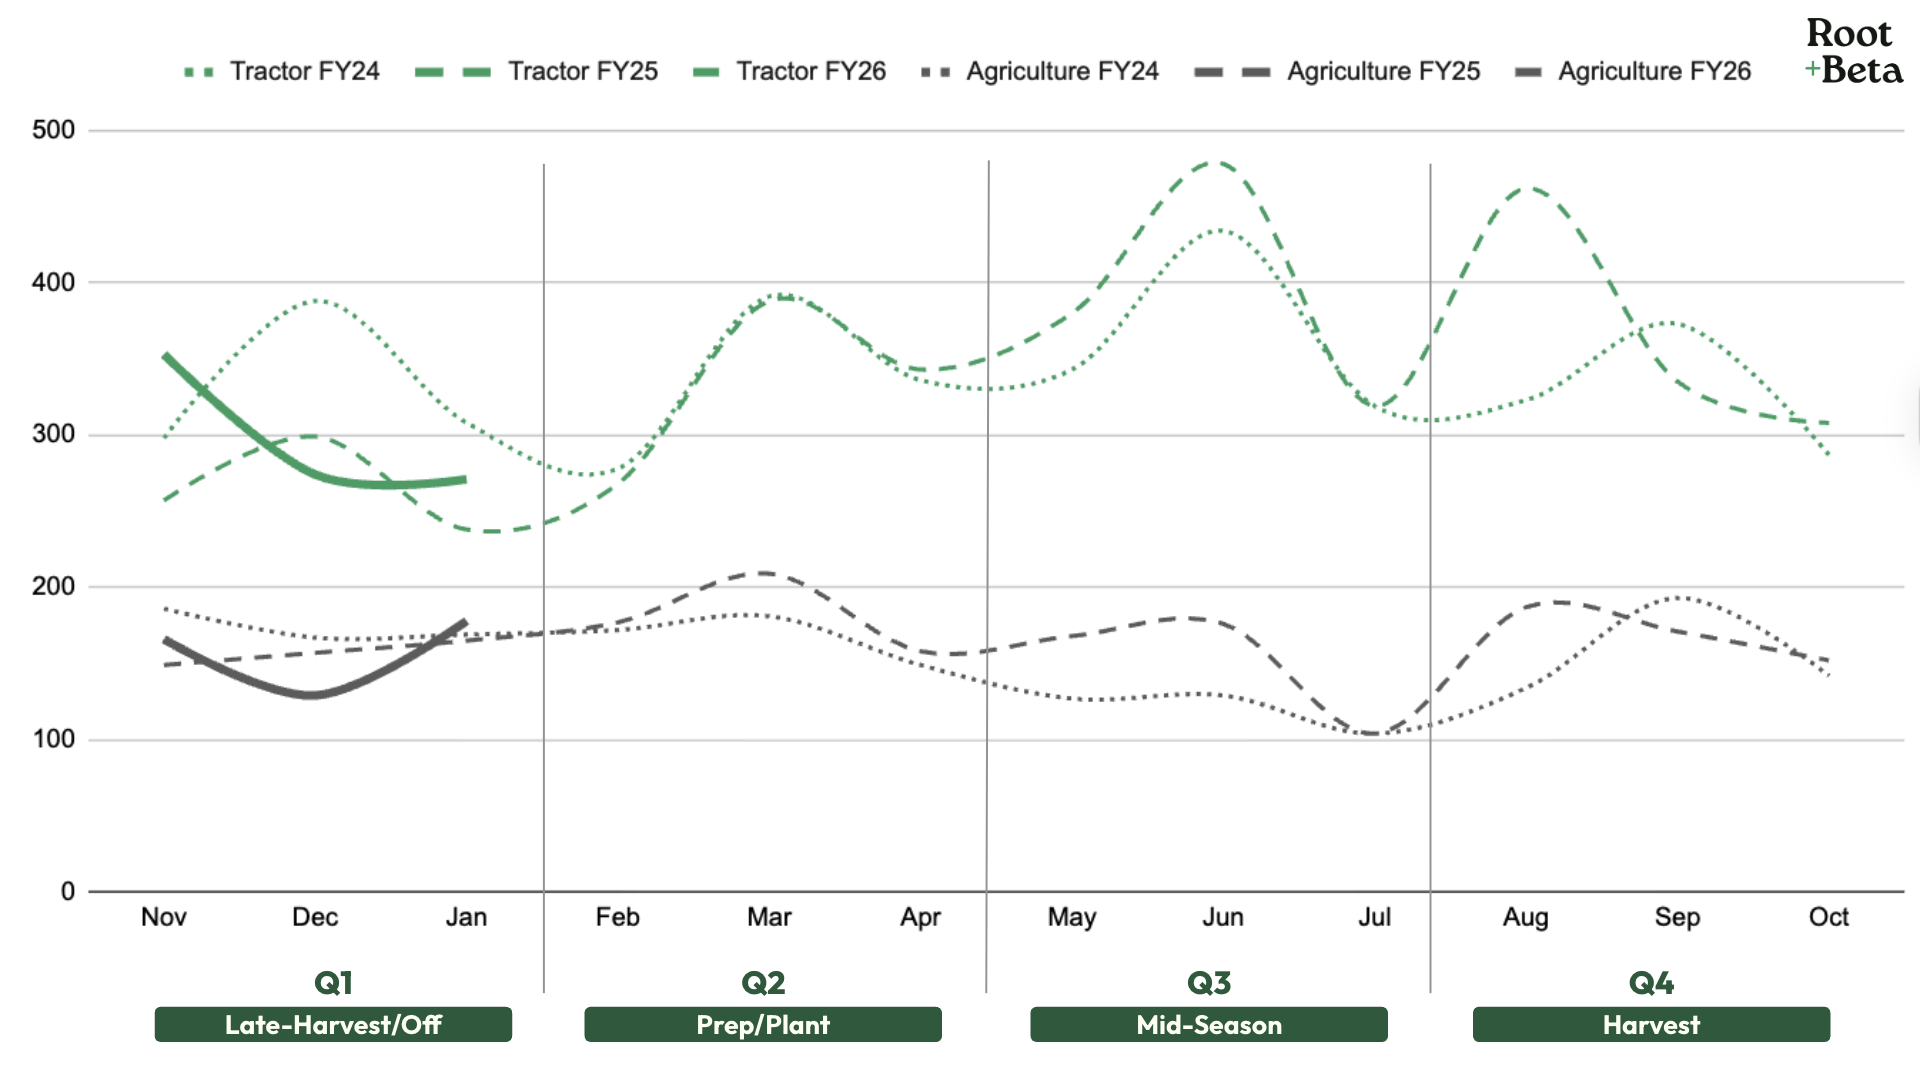
- Q1: November to January — Late-Harvest/Off
- Q2: February to April — Prep/Plant
- Q3: May to July — Mid-Season
- Q4: August to October — Harvest
To provide benchmarks that apply broadly across the industry, we’ve simplified seasonality into four quarters. That said, Root+Beta fully recognizes that seasonality, trends, and buying behavior vary by geography, crop type, and local conditions.
Ag Seasonality Source: US Department of Agriculture | Crop Calendars for United States
Equipment Trends & Advertising Benchmarks Q1 Off-Season Edition includes:
- Seasonal Interest & Sales Trends
- Media Benchmarks
- Digital Display
- Meta Social
- Paid Search
2. Seasonal Interest & Sales Trends
Google Search Trends
We filtered Google Search Trends to the “Agriculture and Forestry” category, isolating search interest around “Tractor” and “Agriculture” topics. This gave us a clearer view of annual patterns and highlighted shifts in audience interest during the Prep/Plant window.
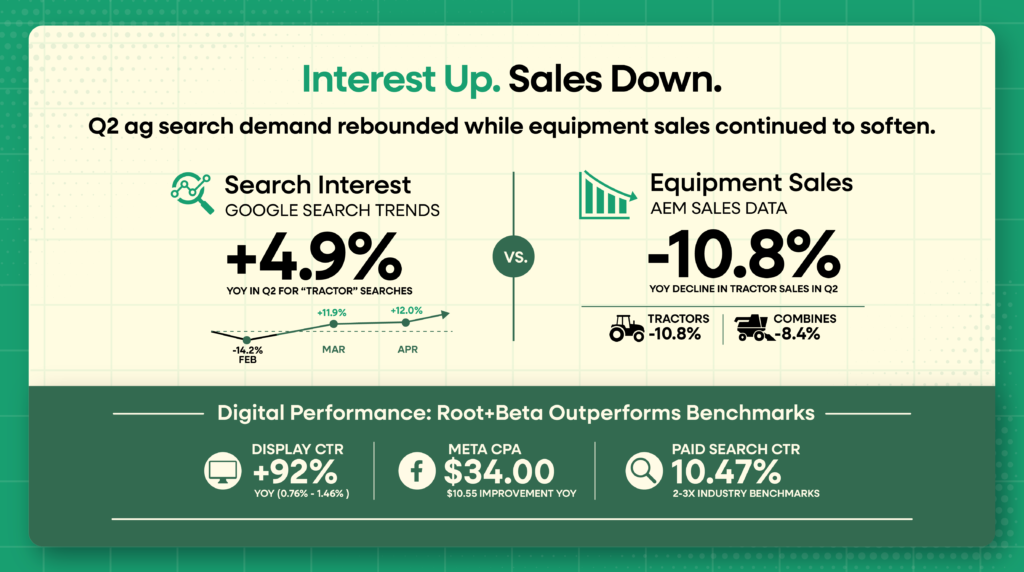
This Prep/Plant season told a tale of ups and downs. Tractor search interest opened the quarter soft — February was down 14.2% YoY, before snapping back with +11.9% in March, +12.0% in April, ending Q2 up 4.9% YoY in aggregate. Search for the broader Agriculture topic moved the other direction, finishing Q2 down 9.9% YoY (Feb -15.8%, Mar -7.7%, Apr -6.3%). The year-over-year uptick in Tractor searches lines up with farmers having already locked in their 2026 agriculture input plans early in the quarter, then turning their attention to long-awaited equipment upgrades once the 2026 Farmer Bridge Assistance (FBA) Program payment timing came into focus, which dedicated $12 billion in economic assistance for farmers to prepare for the 2026 planting season.
Source: Google Internal Data for Agriculture Equipment | United States. Time period: 10/29/2023 – 04/26/2026 (weekly index, monthly aggregates).
Association of Equipment Manufacturers, Sales Data
When we compare Google Search Trends to AEM sales data, Q2 search interest did not translate into a year-over-year sales recovery. Total US Farm Tractor sales were down through the entire Prep/Plant quarter, with the high-horsepower row-crop segment (100+ HP) and 4WD tractors taking the brunt of the pullback. Self-propelled combines started the quarter weak before posting a small April uptick, but YTD through April combines remain essentially flat versus 2025.
The Combines January 2026 lift we flagged in the Q1 report did not extend into Q2. Sales contracted again as the Farmer Bridge program shifted from “announced” to “applying” and farmers held purchasing decisions until payments hit accounts or are more actively utilizing those funds to pay off debts and fund the 2026 input costs.
| US Sales | All Tractors | Combines |
|---|---|---|
| Feb ’26 | ↓ 12.2% | ↓ 12.6% |
| Mar ’26 | ↓ 9.1% | ↓ 25.3% |
| Apr ’26 | ↓ 11.3% | ↑ 3.4% |
| Q2 ’26 | ↓ 10.8% | ↓ 8.4% |
So if new equipment sales continue to be down, are used equipment sales up? No, and if you work in the equipment industry, this is no surprise. Per Tractor Zoom Pro’s April 2026 Equipment Market Update (published May 12, 2026), every major used category sold 30% to 48% fewer units within 60 days versus a year ago, with row-crop tractors (300-424 HP) hit hardest at -47.8% YoY and combines holding up “best” at -31.0% YoY.
In short, interest is up, but new and used farm equipment sales remain dramatically down.
Source: Tractor Zoom Pro, “April 2026 Used Equipment Market Trends,” May 12, 2026.
3. Media Channel Benchmarks
Notes On Data Interpretation
These benchmarks are based on aggregated data from a mix of residential and agricultural equipment campaigns across varied markets. Results may differ based on your location, product focus, budget, and audience – use this data as directional guidance, not a one-size-fits-all standard.
Digital Display Advertising
Digital Display
| Industry | CTR | CPC | CVR | CPA |
|---|---|---|---|---|
| All Industries | 0.46% | $0.63 | 0.77% | $75.51 |
| Auto | 0.60% | $0.58 | 1.19% | $23.68 |
| Ag | 0.47% | $0.64 | n/a | n/a |
| R+B FY25 | 0.76% | $0.52 | 1.91% | $27.17 |
| R+B FY26 Q2 | 1.46% | $0.50 | 1.12% | $45.03 |
Q2 was a quarter that saw great ad targeting and faced a new wave of evolving bot-driven scam placements that overwrite category exclusions.
Root+Beta’s average click-through rate roughly doubled YoY (0.75% to 1.46%) and climbed sharply from Q1 (0.91% to 1.46%) as the available inventory shifted into higher-engagement, higher-cost placements. The CPM moved with it, $3.48 in FY26 Q1 to $7.33 in FY26 Q2, and CPA followed, landing at $45.03 versus $26.50 in Q1. These shifts resulted in quality conversions, but declines in impressions and clicks, which depending on the marketing objective, can be ideal. Root+Beta identified these new placements are a mix of quality website and spam advertising opportunity, empowered by AI and devious workarounds that define mobile games as quality websites. Our team of digital strategists have increased the frequency of manual ad placement QAs to ensure ad spend waste is minimized as much as possible.
Meta Social Advertising
Meta Social
| Industry | CTR | CPC | CVR | CPA |
|---|---|---|---|---|
| All Industries | 0.90% | $1.72 | 9.21% | $18.68 |
| Auto | 0.80% | $2.24 | 5.11% | $43.84 |
| Ag | 0.48% | $0.96 | n/a | n/a |
| R+B FY25 | 1.47% | $0.75 | n/a | n/a |
| R+B FY26 Q2 | 1.60% | $0.82 | 2.42% | $34.00 |
Meta was the standout channel for Q2. Root+Beta’s average cost-per-action dropped to $34.00, a $6.73 improvement over Q1 ($40.73) and $10.55 better than FY25 Q2 ($44.55).
Two things were behind it: seasonal demand drove campaigns’ efficiency, and Root+Beta’s continued investment in strong creative and dynamic ads kept conversion rates climbing. Click and impression costs ticked up slightly, which is the new normal on Meta as more advertisers crowd the auction.
One quick note on the data: with the rollout of our new API reporting platform, Root+Beta now tracks CPA benchmarks consistently across every dealership campaign, so the year-over-year comparisons above are fully apples-to-apples.
Paid Search
Paid Search
| Industry | CTR | CPC | CVR | CPA |
|---|---|---|---|---|
| All Industries | 3.17% | $2.69 | 3.75% | $48.96 |
| Auto | 4.00% | $2.46 | 6.03% | $33.52 |
| Ag | 5.74% | $2.19 | n/a | n/a |
| R+B FY25 | 11.26% | $2.75 | 17.70% | $15.51 |
| R+B FY26 Q2 | 10.47% | $2.49 | 14.93% | $16.66 |
Paid Search conversion costs (CPA) recovered quarter-over-quarter, though the gap versus FY25 hasn’t closed. The search market continues to crowd, in part because Google has trimmed the organic real estate above the fold with AI responses, pushing businesses to invest more into paid auctions to ensure a strong search presence.
Our click costs sit roughly in line with industry benchmarks (both adjacent verticals like Auto and Ag, and the broader All Industries average), but the click-through rate is where Root+Beta stands out: prospects engage with our ads 2 to 3 times more often than the benchmarks. That’s by design. Our paid-search philosophy is built to capture intent and drive action, not chase cheap website traffic.
4. Appendix
Glossary
IMP – Impressions, the total number of times your ad has been seen.
CTR – Click-Through Rate, details ad engagement and interest.
Clicks – Action that leads to the website from ad or engagement clicks help show interactions.
CVR – Conversion Rate, how successful an ad is at converting website visitors to perform an action on the website or platform.
Conv. – Conversions are website results (actions) such as a call or form completion.
CPM – Cost-per-thousand impressions, key for detailing the cost of advertising on a platform.
CPC – Cost-Per-Click, which details how much it costs for an ad interaction (display and SEM).
CPA – Cost-per-action, which details how much it costs for a desired web lead.
Conversions vary based on advertisers’ campaign goals and website opportunities, but generally conversions fall into the following categories: form fills, calls, get directions, etc.
Industry Benchmark Sources