
By Nik Hiles, Manager of Marketing Strategy
1. Introduction
At Root+Beta, we’ve spent the last 15 years deep in the field helping agriculture equipment dealers and ag companies across the United States navigate the evolving world of digital advertising. With over $85 million in ad spend managed, R+B’s seasoned team of 40 brings unmatched industry expertise, data access, and insight to our clients every day.
As a Google Premier Partner, Root+Beta has full access to the Google Marketing Platform, beta programs, and advanced toolsets, but more importantly, we understand what matters to agriculture and equipment marketers.
Why We Built This Report
Let’s be honest: reliable benchmark data for ag and equipment marketing is almost impossible to find. We were just as frustrated — so we built our own. This report compiles real-world performance data from over 20 ag equipment dealer groups, spanning campaigns across key digital platforms: Meta (Facebook and Instagram), Digital Display, Paid Search, and Performance Max. Every data point has been aggregated, quality-checked, and contextualized for ag marketers like you.
And this isn’t just about curiosity. Benchmarking gives you a critical perspective: it shows where you stand, how…
From our perspective, marketers should be measuring performance against three groups of data:
- Your historic performance
- Your industry’s performance
- The platform’s performance
This report zeroes in on #2 — your industry’s performance — across the most important channels for equipment advertising.
Agriculture Quarters
We’ve aligned our quarterly data with the agricultural planting and harvest cycle rather than the standard calendar year. This structure better reflects how ag businesses operate and when key marketing opportunities occur:
- Q1: November to January Late-Harvest/Off
- Q2: February to April Prep/Plant
- Q3: May to July Mid-Season
- Q4: August to October Harvest
To provide benchmarks that apply broadly across the industry, we’ve simplified seasonality into four quarters. That said, Root+Beta fully recognizes that seasonality, trends, and buying behavior vary by geography, crop type, and local conditions.
Ag Seasonality Source: US Department of Agriculture | Crop Calendars for United States
This Equipment Trends & Advertising Benchmarks
Q4 Harvest Edition includes:
- Seasonal Interest & Sales Trends
- Media Benchmarks
- Digital Display
- Meta Social
- Paid Search
2. Seasonal Interest & Sales Trends
Google Search Trends
We filtered Google’s search trends down to the “Agriculture and Forestry” search category, isolating search interest around “Tractor” and broader “Agriculture” topics. This gave us a clearer view of annual patterns and helped highlight shifts in audience behavior.
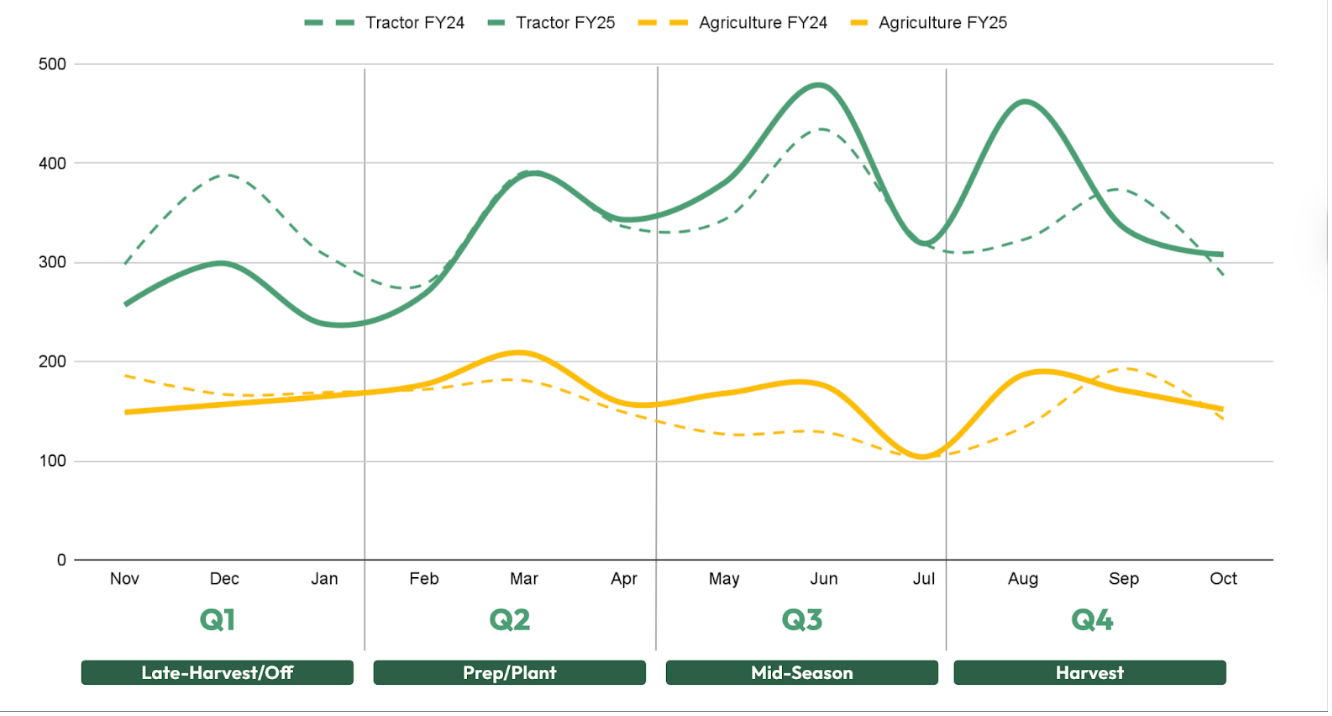
Q3 followed 2024’s trends with a higher volume of searches, with July dipping as it has for the past decade. August ’25 showed a stronger rebound in tractor-topic searches, with a 139-point lift year-over-year, up 43%, while September ’25 saw a 38-point drop, down 10%. Agriculture-topic searches followed a similar pattern with growth in August and a slowdown in September. By October, both tractor and agriculture search activity leveled out.
Farmers are emphasizing efficient workflows, such as harvesting certain crops first, managing field access, and unloading and drying grain, to make the limited “harvest window” count. During this time, they also start thinking about how the new year will play out as they transition into the off-season.
Rural property owners also need to be considered since they play a large role in the compact tractor market, including within our tractor-topic searches. August marks the last full month of summer, and as winter approaches and the ground hardens and grass stops growing, the need for compact tractors drop.
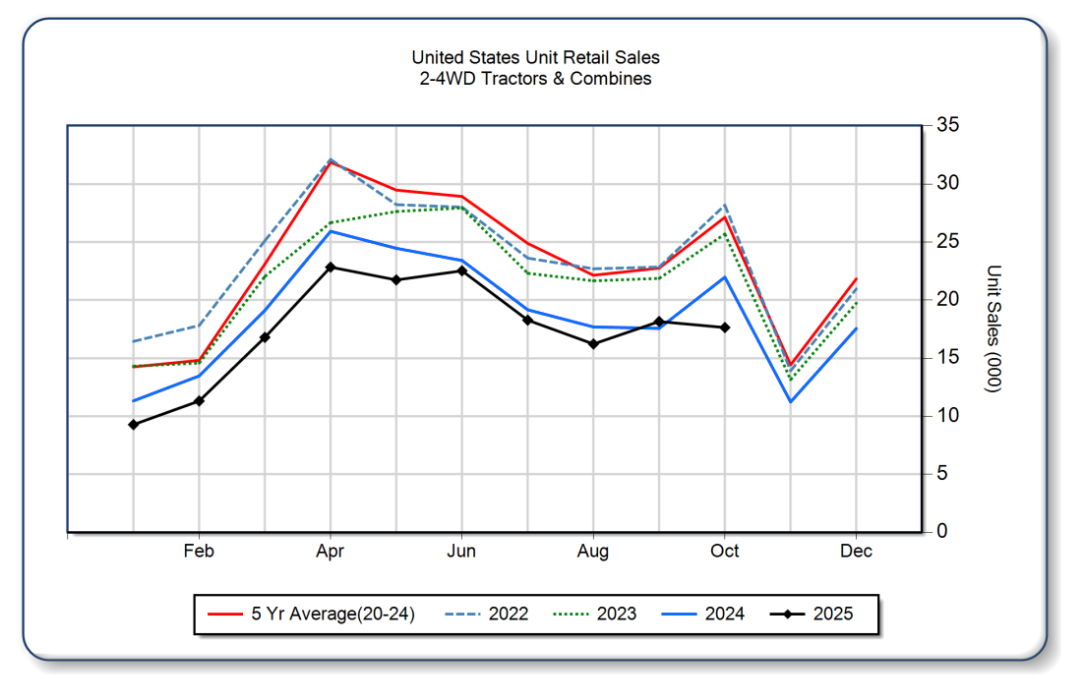
Association of Equipment Manufacturers, Sales Data
While interest in FY25 has remained fairly steady, sales have not followed. Overall tractor and combine sales have been down consistently since January ’25, with September being the only month that exceeded 2024’s sales figures.
| US Sales | All Tractors | Combines |
|---|---|---|
| Aug ’25 | ↓ 8% | ↓ 35% |
| Sep ’25 | ↑ 4% | ↓ 22% |
| Oct ’25 | ↓ 20% | ↓ 27% |
This news will not be surprising to anyone working in equipment sales. It has been a difficult year, with marketers seeing fewer qualified leads and sales teams having to work harder to close each sale opportunity.
Root+Beta is committed to partnering with equipment and agricultural brands during this difficult time. We remain focused on providing as many qualified leads as possible and growing brand preference so that when sales opportunities increase, our partners are in position to capture them.
AEM Sales Chart, Tractors & Combines
3. Media Channel Benchmarks
Notes On Data Interpretation
These benchmarks are based on aggregated data from a mix of residential and agricultural equipment campaigns across varied markets. Results may differ based on your location, product focus, budget, and audience — use this data as directional guidance, not a one-size-fits-all standard.
Digital Display Advertising
Like inflation, advertising costs continue to rise each year, pushing marketers to work harder for the same level of results. Comparing year-over-year cost metrics for Q4, we see the cost per thousand views (CPM) increased from $5.02 to $6.85, and cost per click rose from $0.42 to $0.86, more than doubling.
Is seasonality and market contributing to higher CPCs?
Have shifts in campaign strategy also pushed ad prices up?
Yes, and yes.
Digital Display Advertising Benchmarks
| Period | CTR | CPC | CVR | CPA | CPM |
|---|---|---|---|---|---|
| FY24 Q3 | 0.86% | $0.44 | 0.71% | $61.54 | $3.80 |
| FY24 Q4 | 1.02% | $0.42 | 1.58% | $26.90 | $5.02 |
| FY25 Q3 | 0.76% | $0.92 | 4.95% | $18.50 | $6.94 |
| FY25 Q4 | 0.80% | $0.86 | 2.99% | $28.69 | $6.85 |
Digital display includes static/animated behavioral, website visitor retargeting, responsive, and dynamic campaign types.
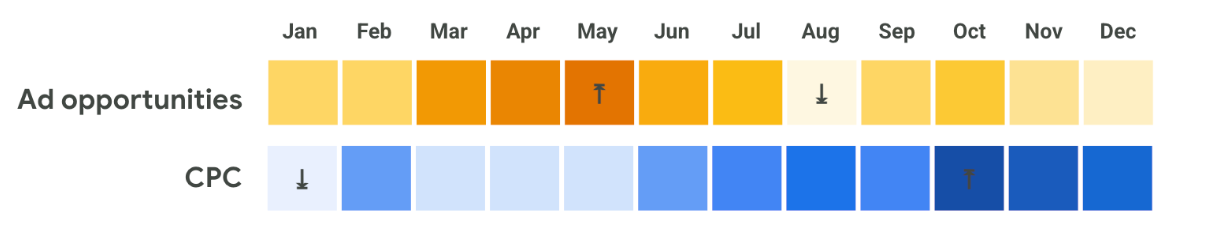
Looking at Google’s internal data for agricultural equipment in the United States, we know that starting in July, advertising opportunities began to decline due to a smaller digital audience. This smaller audience, in turn, causes advertising costs, like CPC, to increase, with October being the pinnacle of click costs. Ad opportunities will continue to be smaller, and CPCs will continue to be high until the new year, as the trends begin to reverse.
Google internal data for Agriculture Equipment | United States.
Time period: 05/24/2025-08/21/2025
Have campaign strategy shifts caused ad prices to increase? At Root+Beta, we’ve been challenging the idea that digital display ads are only useful for awareness and consideration. After 15 years of optimizing campaigns in the equipment and agriculture industry, we’ve driven conversion costs under a $30 CPA. For reference, Google reports the ad type’s average CPA at $75.
No magic wands were involved in reaching this level of performance. R+B’s Positive Dissatisfaction mindset pushed our media specialists and marketing strategists to refine ad creative, test tactics like feed-based ads, and use industry-leading targeting data and parameters.
Of course, R+B’s performance benchmarks are relative to the advertisers who partner with us, so we’ve also pulled benchmarks from multiple sources to show how performance compares across other industries and the platform as a whole.
Cross-Industry Display Benchmarks | Root+Beta
| Industry | CTR | CPC |
|---|---|---|
| All Industries | 0.46% | $0.63 |
| Auto | 0.60% | $0.58 |
| Ag | 0.47% | $0.64 |
| Root+Beta EQ | 0.76% | $0.38 |
OPTIMIZATION OPPORTUNITY: With advertising audiences smaller and display costs elevated through December, we recommend shifting some focus away from mass-awareness campaigns and leaning more into value-driven campaigns to support your business during the late fall and winter months.
Meta Social Advertising
Similar to what we observed in Q1 and Q2, Meta Social CPMs remained stable in Q3 and even dropped in Q4, countering the seasonal cost shifts seen on Google’s ad platforms. We’ve also seen click-through rates and click costs improve year-over-year through Root+Beta’s ongoing efforts to strengthen performance.
Meta Social Advertising Benchmarks | Root+Beta
| Period | CTR | CPC | CPM |
|---|---|---|---|
| FY24 Q3 | 0.99% | $1.19 | $11.76 |
| FY24 Q4 | 1.49% | $0.93 | $13.97 |
| FY25 Q3 | 1.36% | $0.81 | $11.01 |
| FY25 Q4 | 1.56% | $0.69 | $10.78 |
It’s well known that advertising on Meta Social costs more on an awareness basis, but when you shift to the next level, ad engagement, we’re excited to share that Root+Beta has achieved a lower cost per click on Meta Social than on Digital Display through continual digital and creative optimization across all our partners’ campaigns.
CPM
• Display $6.85
• Social $10.78
CPC
• Display $0.86
• Social $0.69
Looking at Root+Beta’s aggregation of benchmark data, we see that the Ag industry is more affordable to advertise in, with lower CPCs, but less likely to engage, with lower CTRs, compared to the All and Auto industry categories. Root+Beta’s benchmarks highlight the agency’s ability to drive low-cost clicks at a high rate.
Cross-Industry Meta Social Benchmarks
| Industry | CTR | CPC |
|---|---|---|
| All Industries | 0.90% | $1.72 |
| Auto | 0.80% | $2.24 |
| Ag | 0.48% | $0.96 |
| Root+Beta EQ | 1.50% | $0.75 |
OPTIMIZATION OPPORTUNITY: While Meta has continued to de-emphasize manual bidding and microtargeting over the last year to favor AI-powered advertising, Root+Beta continues to support our Doppio® media buying philosophy: Data-Driven Automation + Human Optimization. We will never surrender full control of our ads to the platforms and instead use the capabilities they offer alongside our industry expertise.

We recommend that all marketers follow the same philosophy. Explore AI and automation tools with a balance of caution and curiosity, while keeping the core strategy human-led.
Paid Search
Owning a strong presence on the first page of Google continues to get more complicated as AI-generated results, Google Business Listings, and product listing ads push both paid search ads and organic results further down the page. These shifts have only increased the importance of investing in paid search to ensure you’re visible when prospective customers are looking for information and solutions.
For this section, we’ve segmented performance into key categories: Compact Utility Tractors, Equipment Solution Near Me, and Root+Beta’s industry-wide averages, along with comparisons to broader benchmarks.
Paid Search Benchmarks – Compact Utility Tractor
| Period | CTR | CPC | CVR | CPA |
|---|---|---|---|---|
| FY24 Q3 | 9.76% | $3.38 | 12.79% | $26.42 |
| FY24 Q4 | 9.80% | $3.47 | 19.12% | $18.14 |
| FY25 Q3 | 11.32% | $3.27 | 14.26% | $22.93 |
| FY25 Q4 | 9.53% | $3.79 | 11.64% | $32.58 |
Unlike FY24 Q4, where the CPA dropped quarter over quarter, FY25 Q4 saw a 42% lift in CPA. With Google’s seasonal platform costs noted in the display section also affecting paid search, it’s not surprising to see CPAs rise during the Harvest season. Farmers are busy in the field, and residential compact tractor buyers have fewer tasks to complete as daylight shortens, which naturally slows conversion activity.
Despite the large increase in CPA year-over-year, our click costs only rose 9%, indicating that people are still searching and exploring equipment options but aren’t ready to act. The reason for this delayed action is open to interpretation, but economic uncertainty and the financial challenges many farmers are facing are likely major factors.
Paid Search Benchmarks – Equipment Solution Near Me
| Period | CTR | CPC | CVR | CPA |
|---|---|---|---|---|
| FY24 Q3 | 14.98% | $2.49 | 32.07% | $7.77 |
| FY24 Q4 | 15.38% | $2.64 | 38.45% | $6.86 |
| FY25 Q3 | 17.27% | $3.11 | 39.43% | $7.88 |
| FY25 Q4 | 16.15% | $3.18 | 35.24% | $9.03 |
Similar to the Compact Utility Tractor campaigns, FY25 Q4 saw cost metrics increase. As noted earlier, the data shows that people are still searching and exploring their equipment options but aren’t as ready to act.
Root+Beta’s average across paid search campaigns continues to outperform industry norms by a wide margin, delivering roughly double the average CTR of the Ag category and a CPA that is $33 lower than All Industries. Our long-standing campaign optimizations, keyword discipline, and post-click strategies are clearly driving qualified leads efficiently.
Cross-Industry Paid Search Benchmarks
| Industry | CTR | CPC | CVR | CPA |
|---|---|---|---|---|
| All Industries | 3.17% | $2.69 | 3.75% | $48.96 |
| Auto | 4.00% | $2.46 | 6.03% | $33.52 |
| Ag | 5.74% | $2.19 | n/a | n/a |
| Root+Beta EQ | 11.26% | $2.75 | 17.70% | $15.51 |
OPTIMIZATION OPPORTUNITY: While sales opportunities continue to be more sparse, we recommend pushing through and capturing leads where possible. And when prospective customers aren’t ready to buy, focus on maintaining the relationship and strengthening your brand’s position in their mind.
4. Appendix
Glossary
IMP Impressions: the total number of times your ad has been seen.
CTR Click-Through Rate: details ad engagement and interest.
Clicks: Action that lead to the website from ad or engagement clicks help show interactions.
CVR Conversion Rate: how successful an ad is at converting website visitors to perform
an action on the website or platform.
Conv. Conversions are website result (actions) such as a call or form completion.
CPM Cost-Per-Thousand Impressions: key for detailing the cost of advertising on a platform.
CPC Cost-Per-Click: which details how much it costs for an ad interaction (display and SEM)
CPA Cost-Per-Action: which details how much it costs for a desired web lead.
Conversions vary based on advertiser’s campaign goals and website opportunities, but generally conversions fall into the following categories: form fills, calls, get directions, etc.
Industry Benchmark Sources
- https://www.wordstream.com/blog/ws/2017/02/28/facebook-advertising-benchmarks
- https://www.wordstream.com/blog/ws/2016/02/29/google-adwords-industry-benchmarks
- https://www.storegrowers.com/google-ads-benchmarks/
- https://thinkshiftinc.com/blog/2024-digital-advertising-benchmarks-for-agriculture
Research Sources
- Ag Seasonality Source: US Department of Agriculture | Crop Calendars for United States
- Tractor Sales: Association of Equipment Manufacturers | US Ag Tractor and Combine Reports
- Google Internal Data for Agriculture Equipment | United States.
- Time period: 05/24/2025-08/21/2025
- De-emphasised Manual Targeting: EMarketer | Meta will phase out manual targeting …
- Equipment Sales Data: Successful Farming | Sales data from the Association of Equipment Manufacturers
- https://www.agriculture.com/u-s-farm-tractor-and-combine-sales-continue-decline-in-august-amid-economic-pressures-11811843
- https://www.agriculture.com/u-s-farm-tractor-sales-finally-end-year-long-slump-in-september-11830649
- https://www.agriculture.com/3-big-things-today-nov-13-2025-11848620?utm_source=chatgpt.com